Closing the Checkout-to-Doorstep Gap: A Practical Last-Mile Audit for Resource-Light UK SMEs
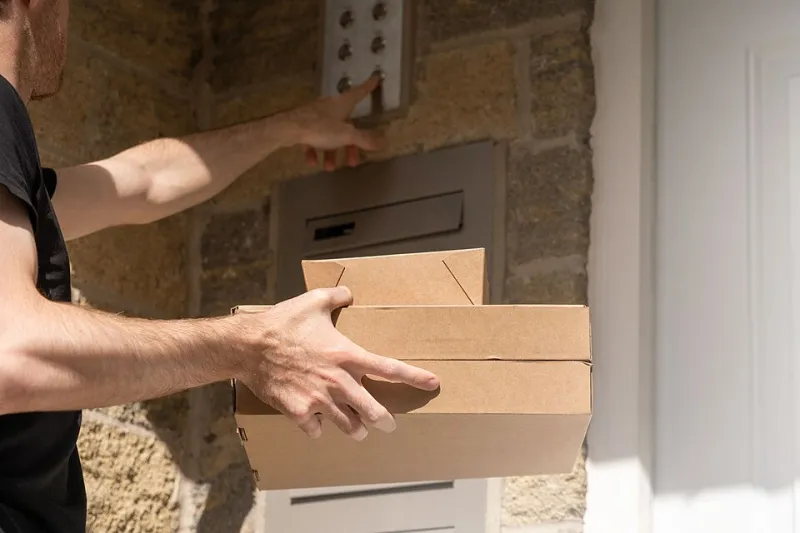
Photo: Meanwell Packaging, CC BY 2.0, via Wikimedia Commons
Every online order contains two delivery experiences. The first is the promise: the service, timescale and price shown at checkout. The second is the reality: what happens when a van arrives, or does not arrive, at the customer's door. For UK SMEs, the distance between those two experiences is a commercial issue, not merely an operational one. A late parcel can be forgiven; a parcel that repeatedly fails to arrive, or arrives without warning, can cost a customer permanently.
The challenge is that many small businesses do not have the resources to investigate last-mile performance in detail. They see the symptoms — complaints, refunds, negative reviews, repeated customer service contacts — but not the pattern underneath. A lightweight audit can close that gap. It does not require a logistics analyst. It requires a defined sample, a simple scorecard and a monthly routine.
Start with the promise the customer actually sees
Before measuring delivery performance, capture the promise. Review the checkout page, order confirmation, dispatch email and tracking page. Record the delivery options, prices, stated timescales, cut-off times and any tracking claims. Then compare that wording with the carrier service you have actually bought. A common mismatch is a checkout that implies next-day delivery while the underlying service is a two-day tracked product, or a tracking page that promises live updates when the carrier only scans at key points.
The audit should also cover postcode exclusions and regional differences. A promise that holds in London may not hold in the Highlands and Islands, Northern Ireland or rural parts of Wales. If the checkout does not distinguish, the customer will not either.
Measure first-attempt success
First-attempt success is the proportion of parcels delivered successfully on the first attempt without a failed delivery, reattempt or collection by the customer. The formula is straightforward: successful first attempts divided by total attempted deliveries, multiplied by 100. Track it over a four-week period and break it down by carrier, service and postcode group.
For an SME, a sample of 50 to 100 parcels is usually enough to reveal a pattern. The important step is to define "success" consistently. A parcel left in a safe place counts only if the customer agreed to that safe place. A parcel left with a neighbour counts only if the customer accepts that outcome. The definition should be written down so that the numbers are comparable month to month.
Classify failed-delivery reasons
Failed deliveries are not a single problem. They have different causes and different remedies. Ask each carrier for reason codes and group them into a small set of categories: customer not at home, no safe place available, address or access issue, parcel refused, parcel damaged, and carrier operational failure. If reason codes are unavailable, sample customer service notes and tracking events manually.
The pattern often points to the action. A high rate of "no safe place" may justify a clearer safe-place option at checkout. A cluster of address issues may point to postcode validation. A concentration of carrier operational failures may justify a review meeting or a service change. The audit does not need to solve every cause immediately; it needs to identify the largest and most controllable ones.
Calculate cost per successful drop
Cost per successful drop is a more useful measure than headline carriage cost because it includes the cost of failure. A simple formula is: total delivery cost plus reattempt cost plus customer service cost plus refund or replacement cost, divided by the number of successful first-attempt deliveries.
As an illustrative example, suppose a business spends £500 on 100 deliveries. Ten fail on the first attempt. Each failure generates £4 in reattempt cost and £3 in customer service cost, and two failures lead to a refund averaging £30. The total cost is £500 plus £40 plus £30 plus £60, or £630. If 90 deliveries succeed first time, the cost per successful drop is £7.00 rather than the headline £5.00. The figures are hypothetical, but the method is practical. It shows that a cheaper carrier can become more expensive once failure is included.
Understand the returns impact
Last-mile failure and returns are connected. A parcel that is delayed, left in the wrong place or damaged is more likely to be returned or refunded. Review returns by carrier and by reason, and compare return rates for parcels that had a delivery exception with those that did not. Even a simple split between "delivered first time" and "delivered after exception" can be revealing.
The audit should also capture the cost of returns processing: label cost, inspection time, restocking and refund administration. If returns are rising while first-attempt success is falling, the delivery operation is likely contributing to the cost. That insight is useful in carrier reviews and in decisions about packaging, communication and service levels.
Build a one-page carrier scorecard
A carrier scorecard does not need to be elaborate. One page is enough. Score each carrier monthly on first-attempt success, top three failed-delivery reasons, cost per successful drop, average transit time, exception response time, invoice accuracy and customer complaints. Use a simple one-to-five rating for qualitative measures and actual figures for quantitative ones.
| Measure | What to record | Why it matters |
|---|---|---|
| First-attempt success | Percentage of parcels delivered first time | Shows doorstep reliability |
| Failed-delivery reasons | Top three causes by volume | Points to corrective action |
| Cost per successful drop | Total delivery and failure cost divided by successful first attempts | Reveals true cost |
| Transit time | Average and 90th percentile days | Tests the checkout promise |
| Exception response | Time to resolve an open issue | Measures operational support |
| Invoice accuracy | Surcharges and charges checked against agreement | Protects margin |
| Customer complaints | Delivery-related contacts per 100 orders | Connects operations to reputation |
The scorecard should be reviewed with the carrier, not simply filed. A short monthly call with two or three specific questions is often more effective than a long quarterly report.
Put the audit into a monthly rhythm
A lightweight audit works best as a routine. Sample parcels weekly, update the scorecard monthly and review carrier performance quarterly. Keep the definitions stable so that trends are visible. Share the headline findings with the team that handles customer service, because they often see the reality before the data does.
For UK SMEs, the goal is not to replicate a large retailer's logistics department. It is to make the checkout-to-doorstep gap visible and manageable. ACI Express works with small and medium-sized businesses that need reliable delivery and operations support without building a permanent logistics function, helping them turn last-mile data into practical decisions.